A classmate asked in our irc-channel earlier today about performance testing the system he’s working on. We discussed a bit about JMeter and I thought I’d share the set-up I used to, in particular, determine the maximum sustained throughput.1
More specifically:
The goal of these tests is to establish the approximate throughput of serving recommendations on-line and the number of machines required to handle today’s load at Tuenti.
JMeter comes with good documentation for how to set up tests. I suggest starting with this tutorial. It does not, however, come with particularly useful graphing tools. Instead I strongly recommend installing the jmeter-plugins suite.
For our purposes I collected the following metrics:
- Response time over time
- Response time distribution
- Response time percentiles (cumulative distribution)
- Transactions completed per second (throughput)
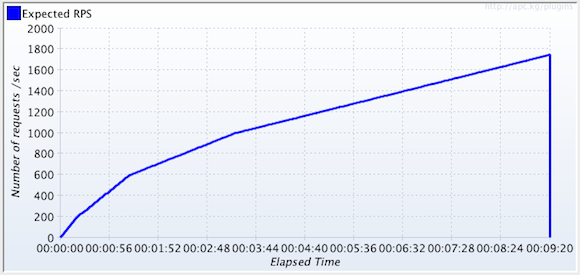
In order to determine the maximum capacity of the system I defined a test which I gradually increased the number of requests per second. Luckily there’s a Throughput Shaping Timer to do exactly this! I suspected the system would start to behave weirdly around 1000 requests per second and thus defined the following. It increases faster in the beginning and then slows down, but steadily increases the throughput to a total of 1700 requests per second.

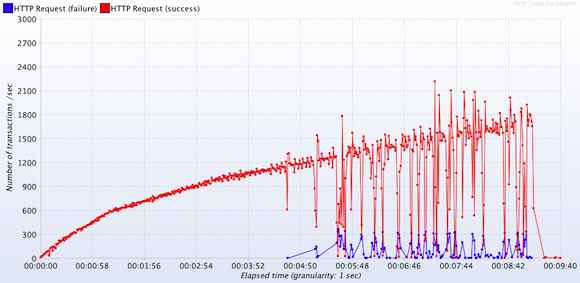
The results below show that at around 1200 requests the system does start to behave weirdly. The blue line shows failed requests, and although I don’t know exactly why yet, it turns out that the application is starting to spit out exceptions at this point.

It could be worse, it could be better. Measuring is the only way of knowing as another classmate would have put it.
1 This may not be the most academic way of doing it, but it gave me sufficient data to know where to focus our efforts.