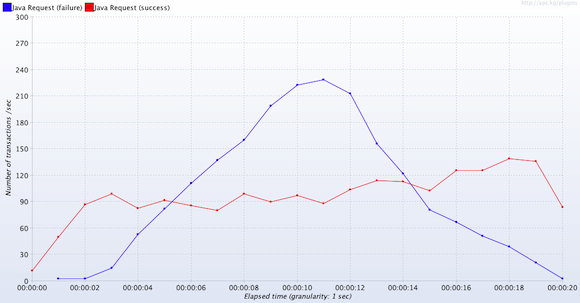
So, first ever results from the recommendation engine running on five machines.

What now? The graph above suggests that there are more failures than successfully answered requests. Not what I had in mind. Moreover, the it fails already around 90-100 requests/second, and there are even failures at a higher rate. Looking at another graph (not posted) the response times are around 1 second which is probably causing the high number of failures as the hard timeouts are configured to 1 second.
What is the cause? There may be several reasons of course. The mistake I’ve made is to run ahead of myself, I think. Here are a few reasons as to why the results may be quite depressing compared to those taken earlier.
- I decoupled the http-interface to a separate java-application (running in a separate JVM). I didn’t want the REST interface to interfere with the Akka system containing the recommendation engine.
- Previously I have only tested the performance with static HTTP requests. This means every request is identical and is routed to the same itemset. In the run above each request is randomly generated. In order to solve this I decided to implement my own Jmeter Sampler. This was a simple exercise, but I’m not sure how much my implementation affects the timing results measured by Jmeter. Maybe I’m doing something wrong?
- All requests are issued over the network. All machines, however, sit in the same rack and the normal round-trip time is about half a millisecond.
- There is a design flaw with the HTTP interface. As I was writing on the report yesterday I got the feeling that the HTTP server doesn’t handle requests concurrently. I.e when the request is accepted and forwarded to the native interface it is blocking before it returns a result and processes the next message. It is more likely, to be honest, that this error is in the native interface that I’ve created though than the HTTP library.
- The design of sharing the workload between the nodes does not work. There is a bottleneck elsewhere that I’m missing. Potential suspects are the native-interface, routing and the workers. Routing is a sequential part of the code base that I’m aware can cause troubles during high workloads, but I didn’t expect it to peak already at ~100 requests/second according to previous measurements.
- I’m missing something else.
Next step will be to try with a smaller set-up (1 node, 1 test machine) locally and see if I get similar results. If not, I’ll try to profile the time spent in the different parts of the application to see where that may lead.
When all else fails…