In preparing the final presentation for tomorrow, one of the hardest concepts I have to explain has one of the easiest motivations to understand. In other words, why I’m taking certain measurements are easy to understand, but how I get them, is certainly not as straightforward.
Why:
- to show that the system does not affect the model, and
- to show that accuracy depends on performance
How:
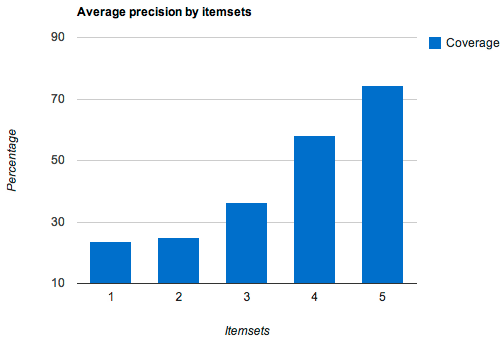
By plotting Mean Average Precision against item coverage. There are two abstract concepts here.
Mean Average Precision is a measure of recommendation accuracy and is commonly used in the algorithmic research on recommenders. In essence it works by asking for a set of recommended items, assuming that we know what items are relevant to a certain user beforehand, we count how many relevant items appear in the set. Using a little aggregation for many users we can compute the mean of all precision values received.
For example, consider the following set: [ a,b,c,d,e,f ] where a, and c are relevant (I determine this by looking at real users’ history). For this set we get the following:
(1/1 + 2/3)/2 = 0.83333...
In other words, average precision for this set is 83%. It is irrelevant how many results are returned, only how high the relevant items rank in the recommended set influence the average precision.
Item coverage is simpler to understand. It shows how many percent of the entire item catalogue that is used to provide the recommendation set. Since the system depends on clustered data, I chose to use this as the input for coverage.
Hence, if I can query all clusters then the MAP value should be identical to the MAP value computed offline (i.e without the online component). If it is, this proves that the system does not affect the model as such.
However, if I query only a subset of the clusters the MAP value should be reduced. This happens because the relevant items for the particular user may not be in the clusters that are used to provide the recommendations. Two conclusions can be drawn from this:
- The system depends on well-balanced clusters for a stable performance/accuracy ratio. If the clusters contain a varying number of items the performance and accuracy become hard to predict.
- Being able to determine the most important clusters (if all cannot be queried) well improves the performance/accuracy ratio.
Naturally, querying more clusters will require more computational resources and thus affect performance.
The graph below shows how MAP increases with coverage. It doesn’t show cluster sizes, but a separate comparison of this lead me to point 1 above.

In the end I think I will keep it super simple and just mention the conclusions. However, the graph and the above explanation will go into the hidden slides section if I get asked a question about it.